
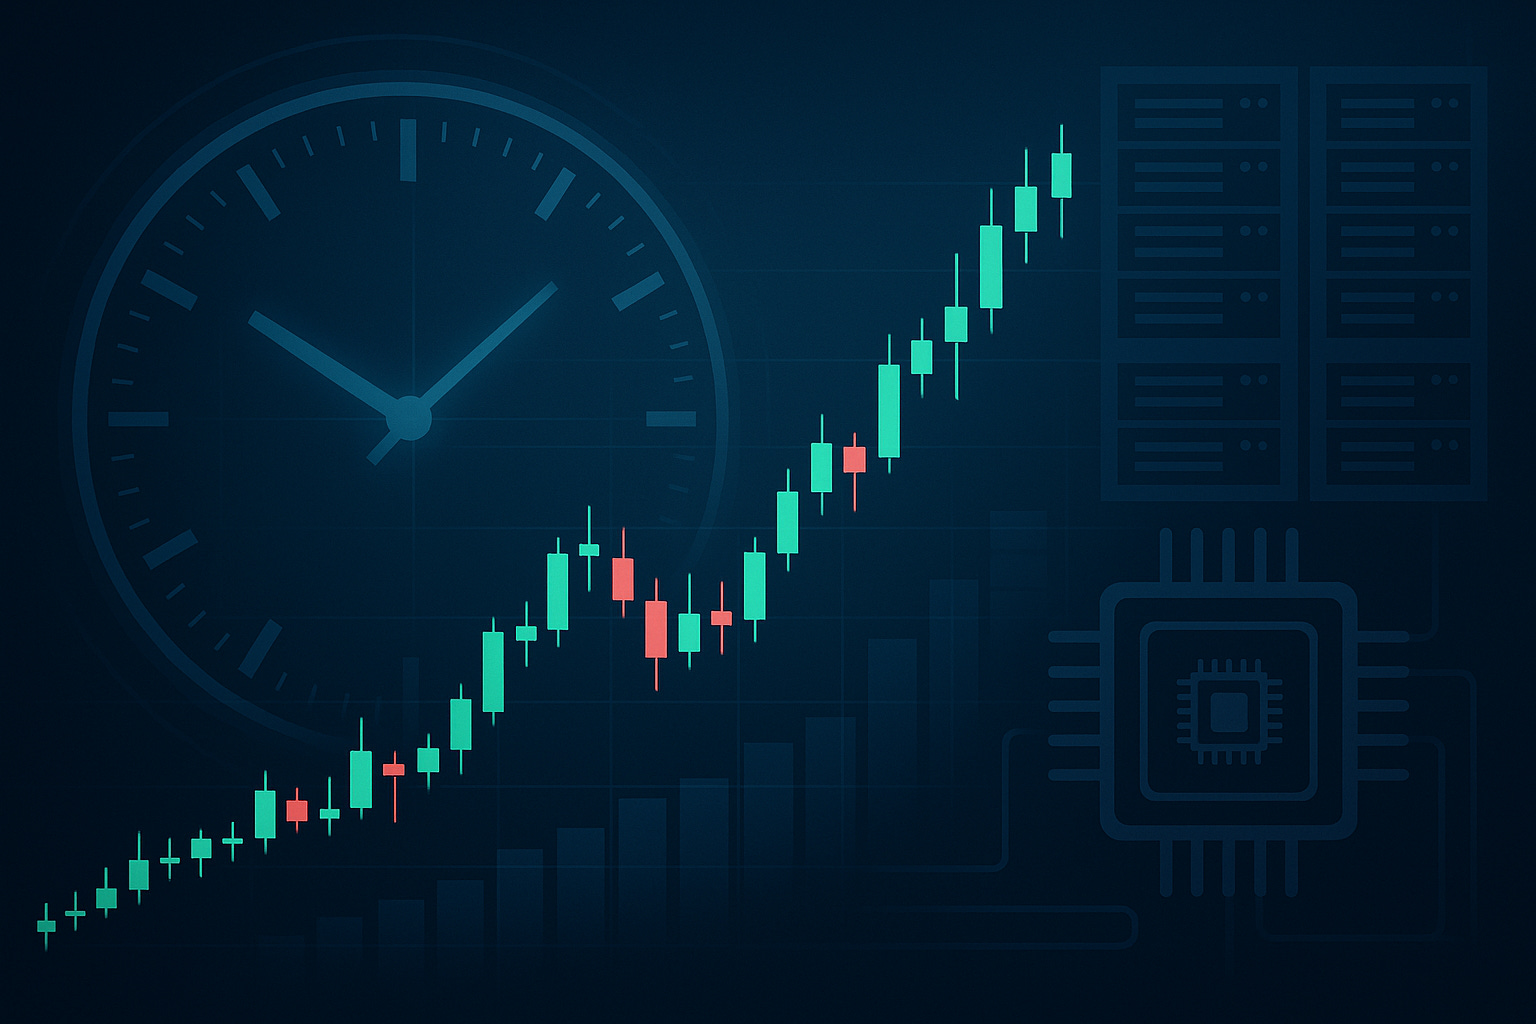
Inside the S&P 500: Cracking a Decade of Market Code
🚀 What backtests reveal about classic buy-and-hold philosophy

After reading a book about Jim Simons and the Medallion Fund, I became curious whether I could time-travel 10 years back, find a trading strategy I could use to outperform the traditional buy-and-hold approach, and get rich 🤔.
My backtest result on the S&P 500 stock dataset is available here. ←
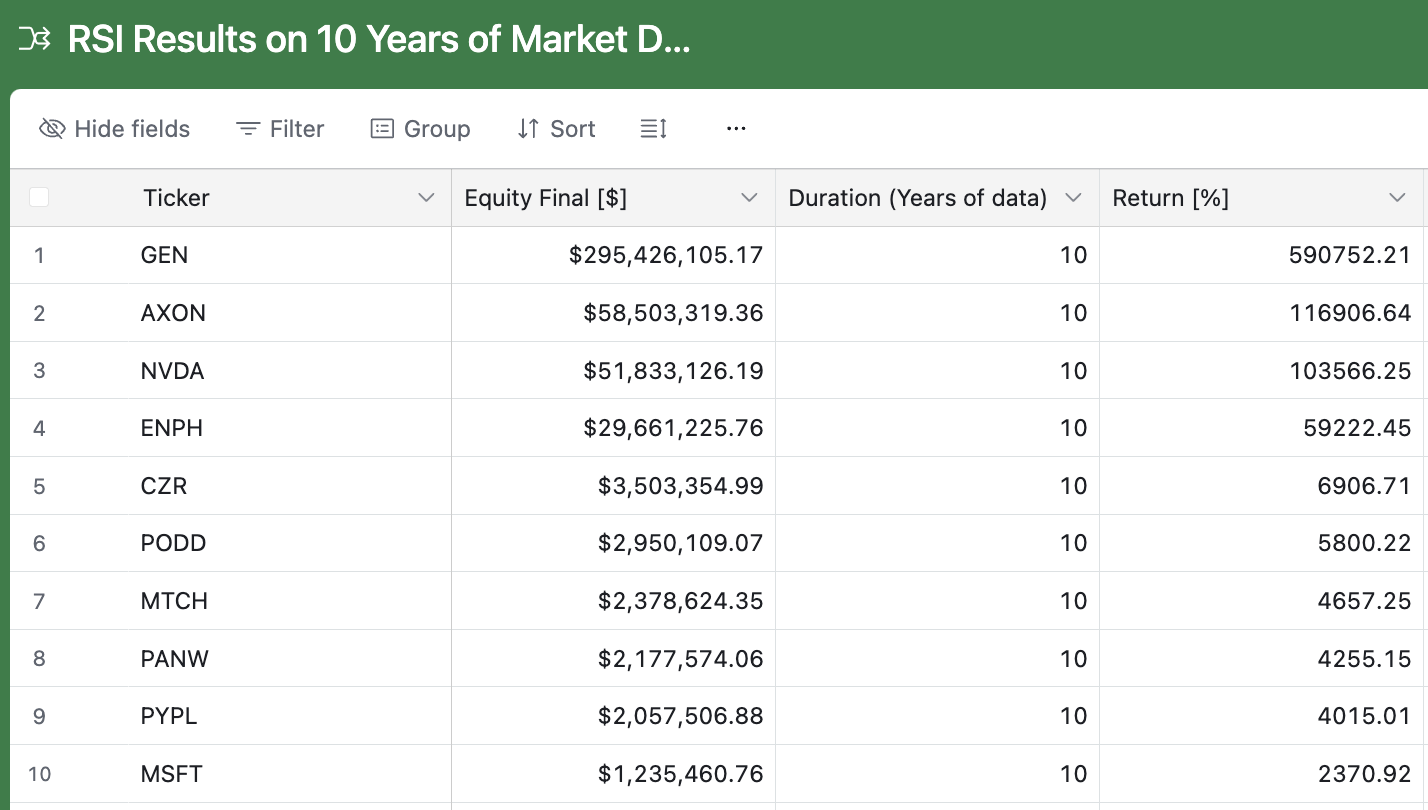
The results are quite interesting. If I had applied my strategy with a seed investment of $50,000, I would have made ~$300 million 💰 🤯 over a decade trading GEN. This was a lot more profitable than buying and holding the same stock for 10 years.
Dataset
For this experiment, I used all the companies listed on the latest S&P 500 index.
503 tickers (since some companies like Google, Fox, and Berkshire Hathaway have multiple share classes).
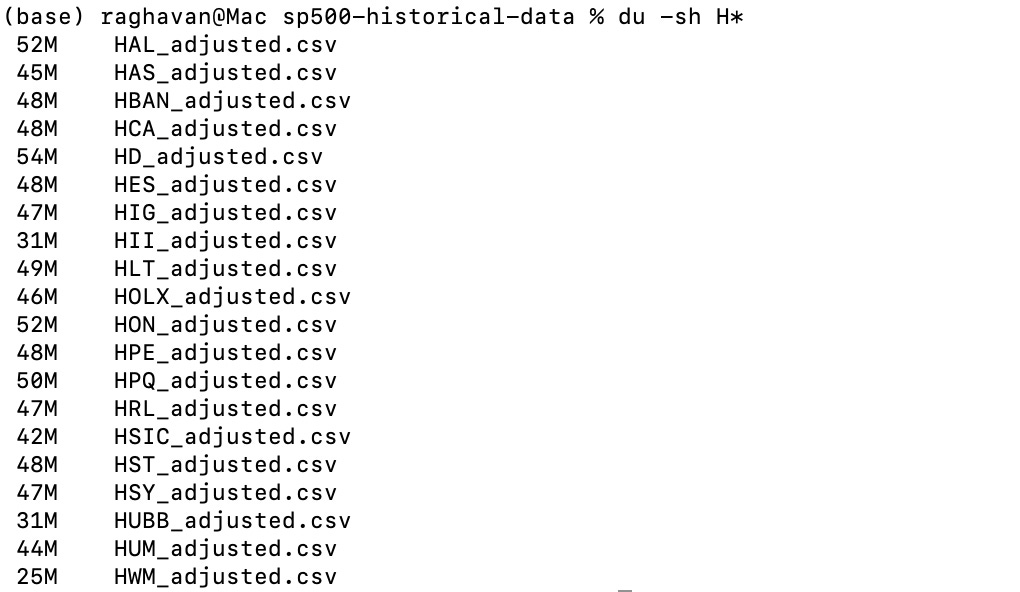
Minute-by-minute OHLCV (open, high, low, close, volume) data for the past decade.
22GB dataset total, with an average file size of ~45MB per ticker.
Downloaded using polygon.io, a good source if you’re a paid user.
All the code used for this experiment is available in this repository:
Strategy
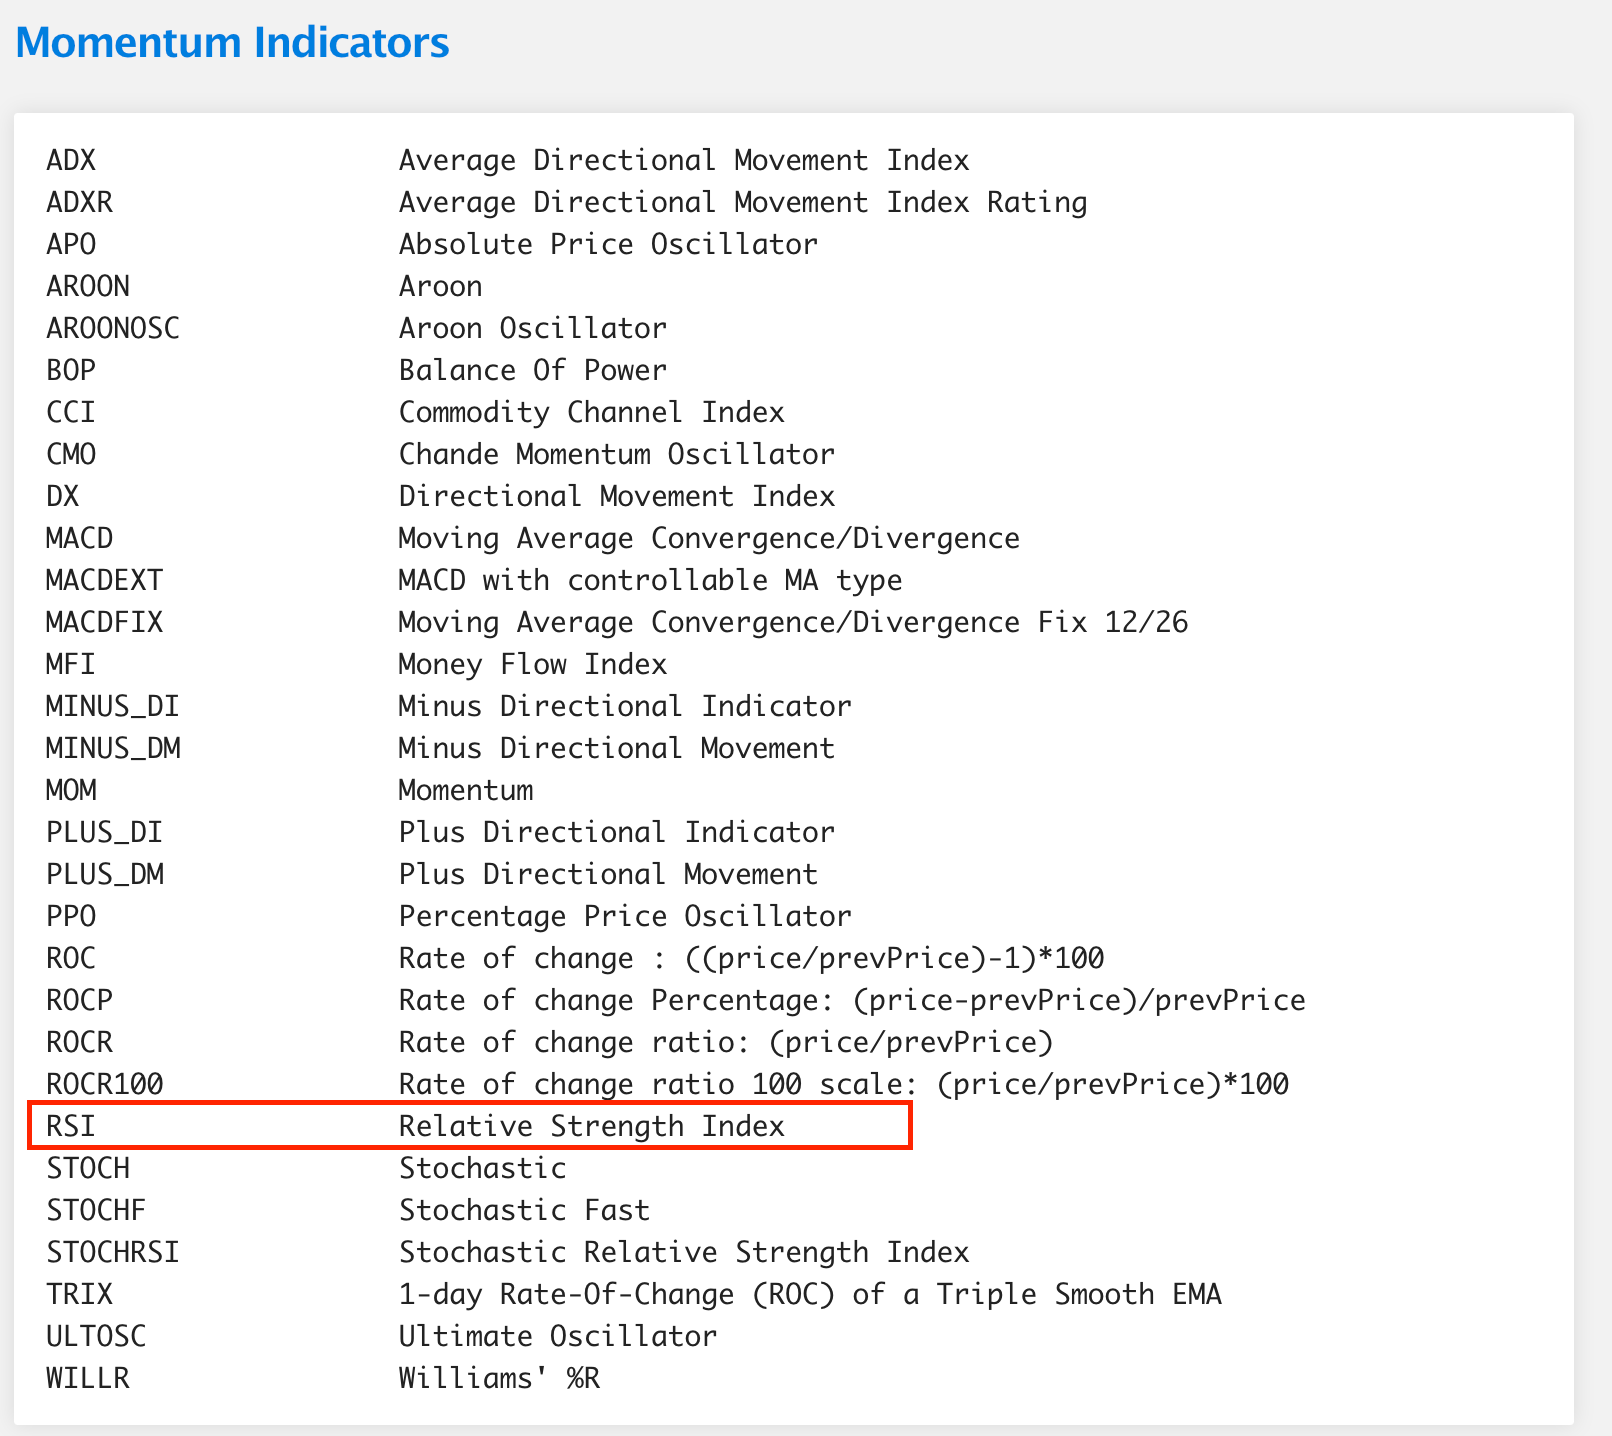
To backtest stock price actions against buy-hold, I chose the Relative Strength Index (RSI) strategy to generate buy and sell signals based on market conditions.
RSI oscillates between 0 and 100.
Below 30 → stock oversold (potential buy signal).
Above 70 → stock overbought (potential sell signal).
🧰 This made RSI a good candidate, as intraday traders widely use it to capture momentum.
🚨 Important note: Indicators that were effective in the past might not be reliable in the future. For example, using RSI on GEN’s latest week of data actually underperformed compared to simply holding the stock.
I also started exploring additional indicators from TA-Lib. I recently read a paper on applying an Opening Range Breakout (ORB) strategy to QQQ data, which outperformed buy-and-hold over 10 years.
Backtesting
💻 Local Setup
Backtesting is CPU-heavy. Running 503 tickers in parallel required optimization.
Machine: Mac M2 Pro (12 cores: 8 performance + 4 efficiency).
Library: Backtesting.py.
Initial run choked all cores — I tuned it down to 6 max threads to reduce context switches.
Final runtime: ~45 minutes to complete the RSI strategy on all tickers.
My backtest result on the S&P 500 stock dataset is available here which were obtained from my local setup.
Snapshot from htop 👇 (all cores in action)
🌧️ Distributed Setup
To execute backtesting based on multiple indicators, I started exploring a distributed solution that could leverage serverless functions like AWS Lambda or GCP Cloud Run.
I explored AWS Lambda to run 503 functions in parallel, with data served from S3. One downside is that Talib has several complex dependencies, which are not easy to package for Lambda, so I had to implement an RSI strategy using LLMs with pure Python(no dependencies).
Challenge: TA-Lib has complex dependencies, so I vibe-coded RSI with pure Python.
Cost/Time:
Single ticker RSI backtest run on Lambda (2048 MB memory): 34.425 seconds, cost $0.0011477.
Processing with concurrency = 500: ~34–40 seconds ✅.
Note: If processed all 503 stocks sequentially, it would have taken 4.78 hours 🤯.
Total cost: ~57 cents for compute + small additional S3 costs.
⚡ Huge improvement vs local execution.
Backtest Results & Metrics
I ran the backtest with the following parameters:
Time Period: The last 10 years (from Aug 2015 to August 2025).
Data Granularity: Minute-by-minute data.
RSI Window: Standard 14-day period.
Initial Capital: $50,000.
Assumptions: Full capital deployment on each trade, and a commission of 0.1% to account for trading fees.
The results were impressive. For the stock GEN, the RSI strategy turned a $50,000 investment into approximately $300 million, a massive win over the simple buy-and-hold strategy.
Hindsight bias is real. What worked historically may not work tomorrow. I've shared the code on my GitHub. I encourage you to check it out, adapt the strategy, and see what you can discover!